1QFY2017 Result Update | Financial
August 1, 2016
Equitas Holdings
BUY
CMP
`195
Performance Highlights
Target Price
`235
Investment Period
12 months
Particulars (` cr)
1QFY17 4QFY16
% chg (qoq) 1QFY16
% chg (yoy)
NII
190.3
162.9
16.9
125.6
51.6
Pre-prov. profit
113.9
87.5
30.1
74.5
52.8
Stock Info
PAT
61.2
46.8
30.7
37.4
63.6
Sector
Financial
Source: Company, Angel Research
Market Cap (` cr)
6,554
Equitas Holdings (Equitas) reported a strong set of results for 1QFY2017. Its AUM
Beta
0.9
grew by 48% yoy which led to a PAT growth of 64% yoy to `61cr, both beating
52 Week High / Low
206 / 134
our expectations. The Management remains confident of sustenance of business growth in
the years to come and expects to start the small finance bank (SFB) by 2QFY2017 end.
Avg. Daily Volume
883,000
AUM growth remained strong, on track to start SFB: The company’s AUM for the
Face Value (`)
10
quarter grew by 48.4% yoy/7.1% qoq to `6,559cr. The MFI, (Vehicle Finance +
BSE Sensex
28,052
MSE), and the Home Finance segments grew by 48%, 50%, and 32% yoy
Nifty
8,638
respectively. We believe the company will be able to achieve similar growth in the
Reuters Code
NA
quarters to come. With the start of the SFB operations, Equitas will also offer
Agriculture Gold Loans and Business Loans which will enable it to meet the
Bloomberg Code
EQUITAS.IN
priority sector lending norm. The AUM mix remained stable.
Rise in NPAs due to migration to 120 days NPA recognition norm from 150 days:
The 27bp sequential rise in GNPAs to 1.61% during the quarter is largely due to
Shareholding Pattern (%)
the company’s migration to 4-months NPA recognition norm from 5 months
Promoters
0.0
earlier. Given that the company intends to start its banking operations by
MF / Banks / Indian Fls
26.9
2QFY2017 end, it will then have to move to the 3-months NPA recognition norm,
FII / NRIs / OCBs
48.5
which could lead to further escalation in NPAs in 2QFY2017. However, from an
operational point of view, the asset quality has not deteriorated, as on a like to
Indian Public / Others
24.6
like basis, the rise in GNPAs for 1QFY2017 would have been of 5-10bp only.
Margins to moderate down: The reported NIM for the quarter has improved to
12% vs 11.92% in 1QFY2016 and vs 11.40% for the entire FY2016 period.
Abs.(%)
3m
1yr
3yr
However, post the initiation of SFB operations, the maintenance of SLR and CRR
Sensex
9.5
1.8
43.2
will impact NIM to some extent. While the new bank will have access to lower cost
Equitas
43.1
NA NA
funds it will take time to get sizeable access to the low cost CASA.
Outlook and valuation: We continue to believe that Equitas is strongly positioned
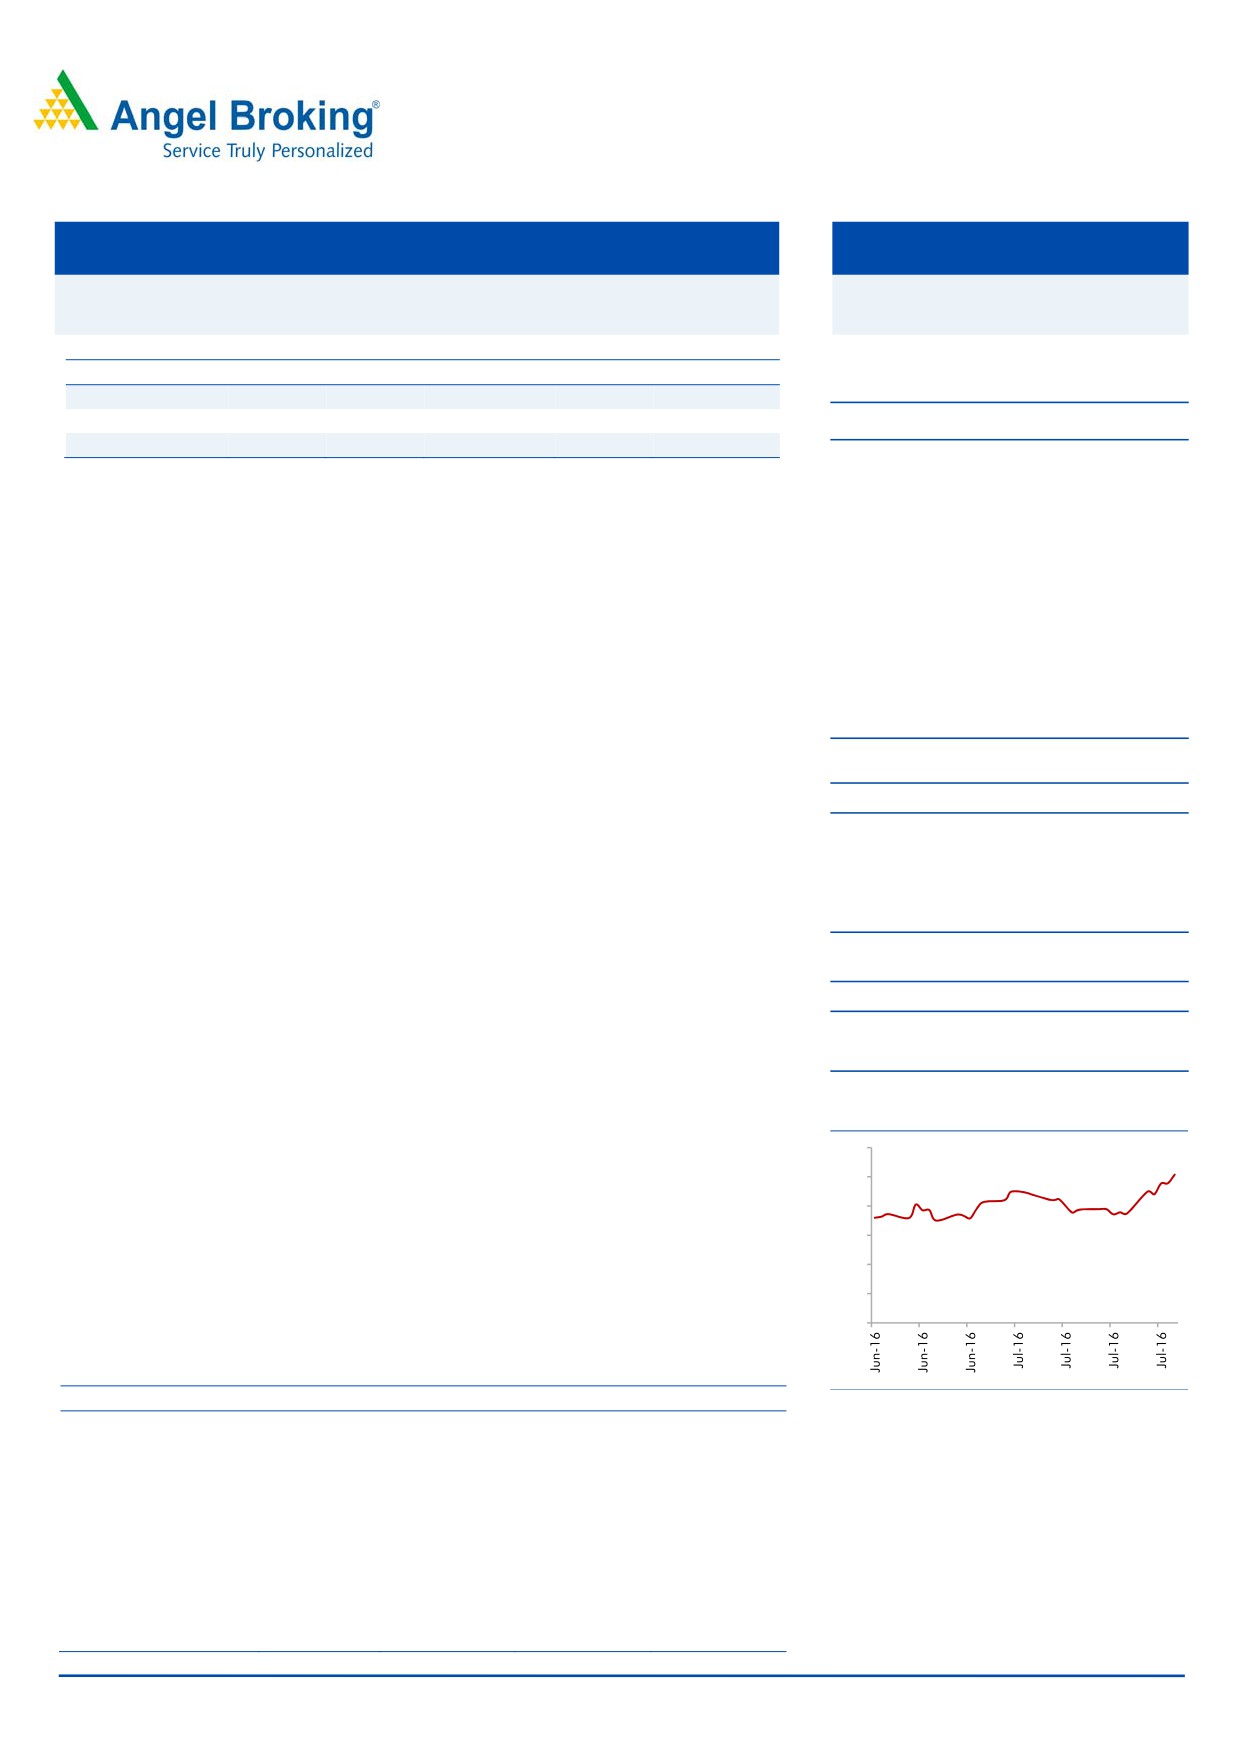
3-Year Daily Price Chart
to grow on the back of its balanced portfolio. Conversion to a SFB will have its
220
own challenges. However, the market segment which the upcoming bank intends
200
to cater to has vast untapped business potential and exploiting it effectively will
180
drive the company’s growth for multiple years. Despite costs having to be incurred
160
in order to meet regulatory requirements (SLR + SRR), we believe the company
140
will be able to deliver a ROA of 2.5% and ROE of 11.5% by FY2018. At the
120
current market price the stock is trading at 2.3x its FY2018E BV of `75.6. We
100
maintain BUY on the stock with a target price of `235.
Key Financials (Consolidated)
Y/E March (` cr)
FY2015
FY2016
FY2017E
FY2018E
Source: Company, Angel Research
Operating Income
460
675
934
1,274
% chg
57.2
46.6
38.4
36.4
Net profit
106.6
167.1
195.6
275.9
% chg
44.0
56.2
17.1
41.0
NIM (%)
12.9
12.4
11.7
11.5
EPS (`)
4.0
6.2
5.8
8.2
P/E (x)
49.0
31.5
33.4
23.7
P/ABV (x)
4.1
3.0
2.7
Siddharth Purohit
RoA (%)
3.0
3.1
2.5
2.5
022 - 3935 7800 Ext: 6872
RoE (%)
11.2
13.3
10.9
11.5
Source: Company, Angel Research; Note: CMP as of July 29, 2016
Please refer to important disclosures at the end of this report
1
Equitas Holdings | 1QFY2017 Result Update
Exhibit 1: 1QFY2017 performance (standalone)
Particulars (` cr)
1QFY17
4QFY16
% chg (qoq)
1QFY16
% chg (yoy)
FY2016
FY2015
% chg
Net interest income
190.3
162.9
16.9
125.6
51.6
577.7
392.1
47.3
Non-interest income
37.0
29.6
24.8
23.74
55.8
101.2
69.1
46.4
Operating income
227.3
192.5
18.1
149.3
52.2
678.9
461.2
47.2
Operating expenses
113.4
105.0
8.0
74.8
51.7
359.7
247.2
45.5
Pre-prov. profit
113.9
87.5
30.1
74.5
52.8
319.2
214.0
49.2
Provisions & cont.
17.6
14.6
20.3
16.5
6.7
59.1
50.4
17.2
PBT
96.3
72.9
32.1
58.1
65.8
260.1
163.6
59.0
Prov. for taxes
35.2
26.1
34.6
20.7
69.8
93.0
57.0
63.3
PAT
61.2
46.8
30.7
37.4
63.6
167.1
106.6
56.2
EPS (`)
1.8
1.4
30.7
1.4
31.1
6.2
4.0
55.0
Cost-to-income ratio (%)
49.9
54.5
50.1
53.0
53.6
Effective tax rate (%)
36.5
35.8
35.7
35.7
34.8
Source: Company, Angel Research
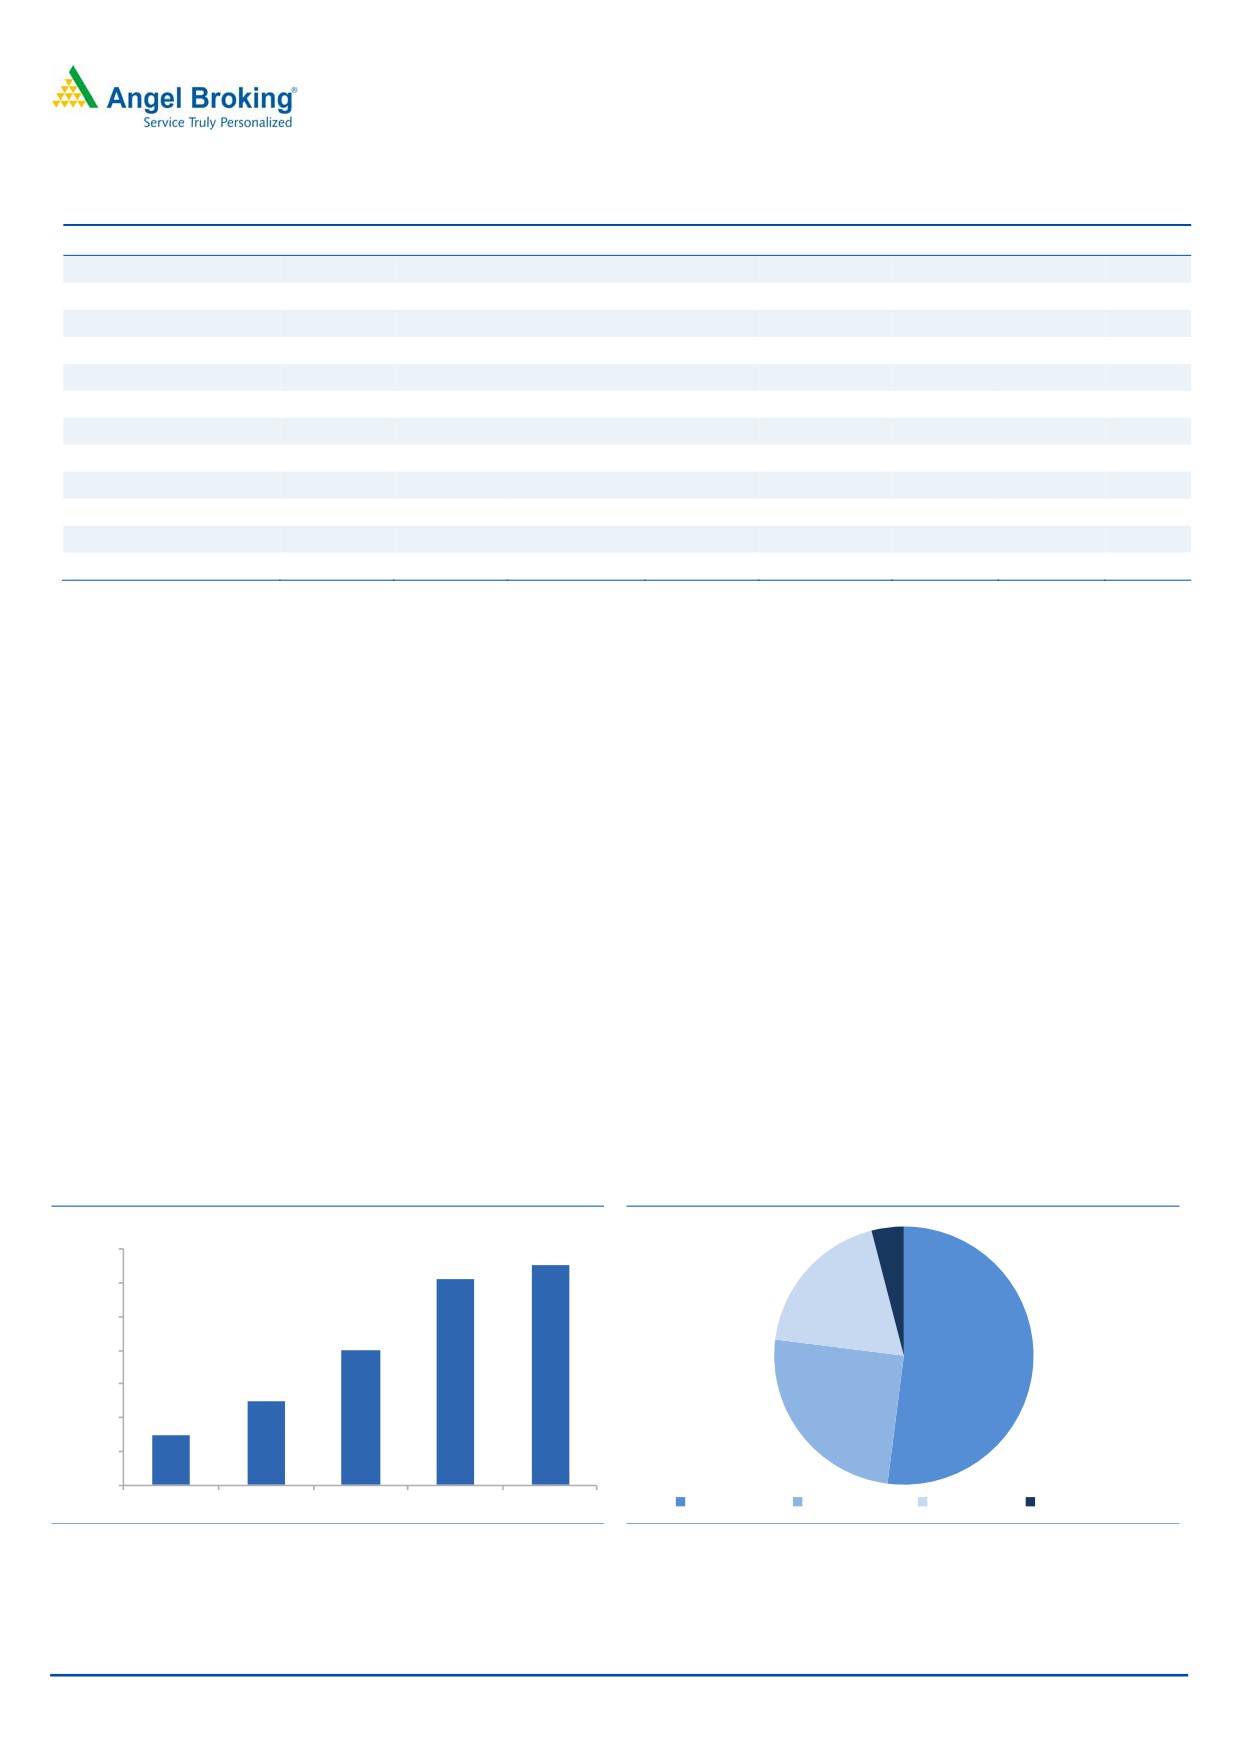
AUM growth remained strong and likely to remain robust going ahead: During the
quarter, Equitas continued to report strong growth in its AUM, which is of 48.4%
yoy / 7.1% qoq. A close look at the segmental performance shows that the growth
has been secular across verticals with the Vehicle Finance + MSE segment
reporting the highest growth of 50% yoy / 10% qoq. The Microfinance business also
grew by a strong 48.4% yoy / 4.8% qoq. The growth was in spite the Tamil Nadu
elections in May 2016 and a severe heat wave hitting the state. With a good monsoon,
we expect growth to pick up further. Though the Management has remained selective
in the Home Finance segment, it has still been able to report a 32% yoy / 4.5% qoq
growth in the segment during the quarter.
AUM mix remains healthy with a bias in favor of non-Microfinance loans: The
Management has been able to grow the balance sheet with a primary focus on the
microfinance segment while the Vehicle Finance + MSE segment also supported
growth. Further, to complement the operations of the upcoming SFB, the
Management intends to start two new products, (a) Agriculture Gold Loans and (b)
Business Loans, which will help the bank in meeting the priority sector lending
norm. The overall AUM mix remained stable.
Exhibit 2: AUM growth remains strong
Exhibit 3: Loan Mix
(` cr)
7,000
6,558
4%
6,125
6,000
19%
5,000
4,010
4,000
52%
3,000
2,486
2,000
1,485
25%
1,000
-
FY13
FY14
FY15
FY16
1QFY17
Micro Finance
Vehicle Finance
MSE Finance
Housing Finance
Source: Company, Angel Research
Source: Company, Angel Research
August 1, 2016
2
Equitas Holdings | 1QFY2017 Result Update
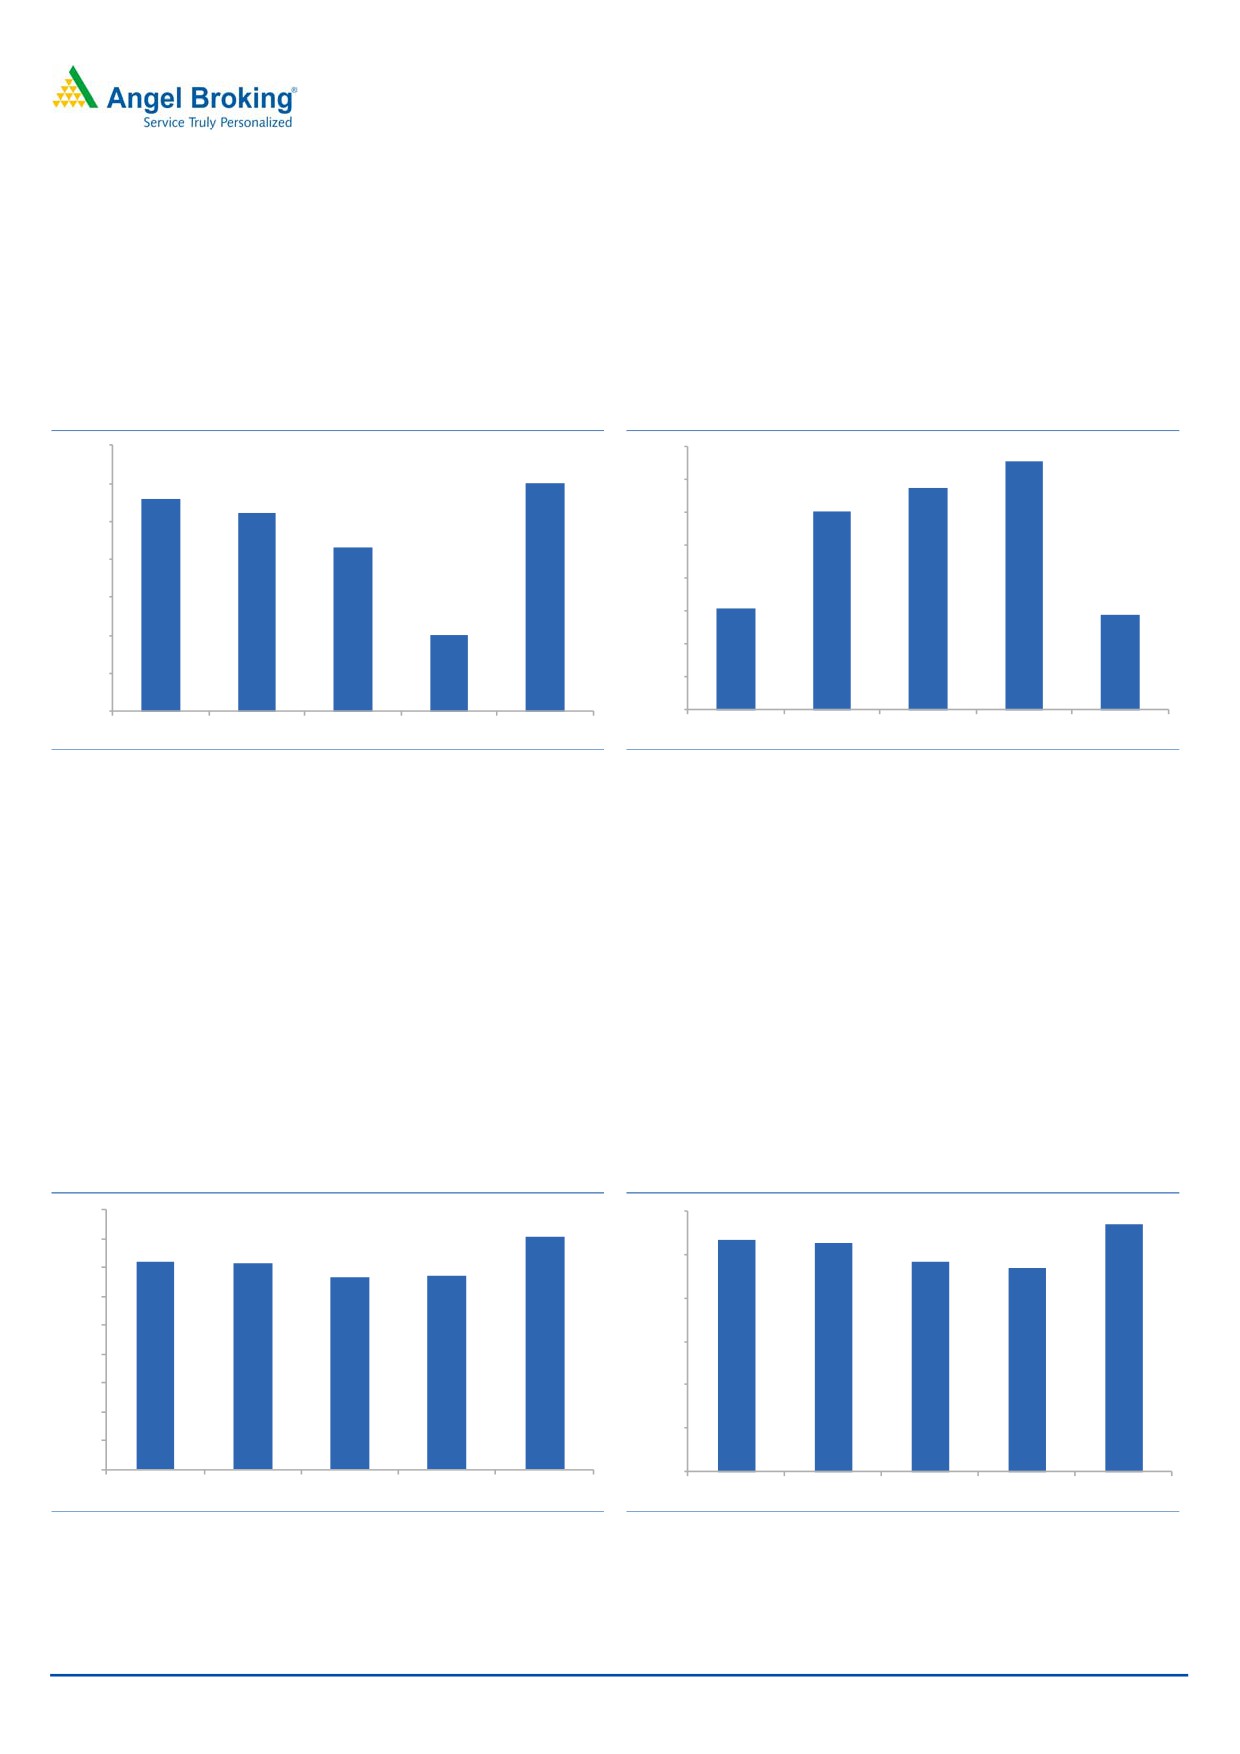
Margins to see moderation: The reported NIM has improved to 12% vs 11.92% in
1QFY2016 and vs 11.40% for the entire year FY2016. However, going forward,
the NIM could take some adverse impact post the conversion to a SFB wherein SLR
and CRR maintenance norms will have to be adhered to. While the new bank will
have access to lower cost funds it will take time to get sizeable access to the low
cost CASA.
Exhibit 4: NIM to see moderation going ahead
Exhibit 5: Cost to Income trend
12.2%
55.0%
54.5%
12.0%
53.7%
12.0%
11.9%
54.0%
11.8%
53.0%
53.0%
11.8%
11.7%
52.0%
11.6%
51.0%
50.1%
11.4%
49.9%
50.0%
11.2%
11.2%
49.0%
11.0%
48.0%
10.8%
47.0%
1QFY16
2QFY16
3QFY16
4QFY16
1QFY17
1QFY16
2QFY16
3QFY16
4QFY16
1QFY17
Source: Company, Angel Research
Source: Company, Angel Research
Asset quality marginally weakened due to migration to NPA recognition at 4
months compared to 5 months earlier: Equitas has so far been able to maintain its
asset quality. The 27bp sequential rise in GNPAs to 1.61% during the quarter is
largely due to the company’s migration to 4-months NPA recognition norm from 5
months earlier. So a large part of the rise in NPA can be attributed to the change
in regulatory compliance norms which the company will have to fall in line with
before starting banking operations. Hence there could be a further rise in NPAs in
2QFY2017. However, without the migration effect, the rise in GNPAs would only
have been of 5-10bp, which indicates at there being no weakness in asset quality
during the quarter. The Management has indicated that with the compliance to the
90-days NPA recognition norm, GNPAs could rise to 2.20%.
Exhibit 6: Rise in GNPAs due to regulatory adherence
Exhibit 7: Trend in Net NPA
1.8%
1.20%
1.14%
1.61%
1.07%
1.05%
1.6%
1.4%
1.4%
0.97%
1.00%
0.94%
1.3%
1.3%
1.4%
1.2%
0.80%
1.0%
0.60%
0.8%
0.6%
0.40%
0.4%
0.20%
0.2%
0.0%
0.00%
1QFY16
2QFY16
3QFY16
4QFY16
1QFY17
1QFY16
2QFY16
3QFY16
4QFY16
1QFY17
Source: Company, Angel Research
Source: Company, Angel Research
August 1, 2016
3
Equitas Holdings | 1QFY2017 Result Update
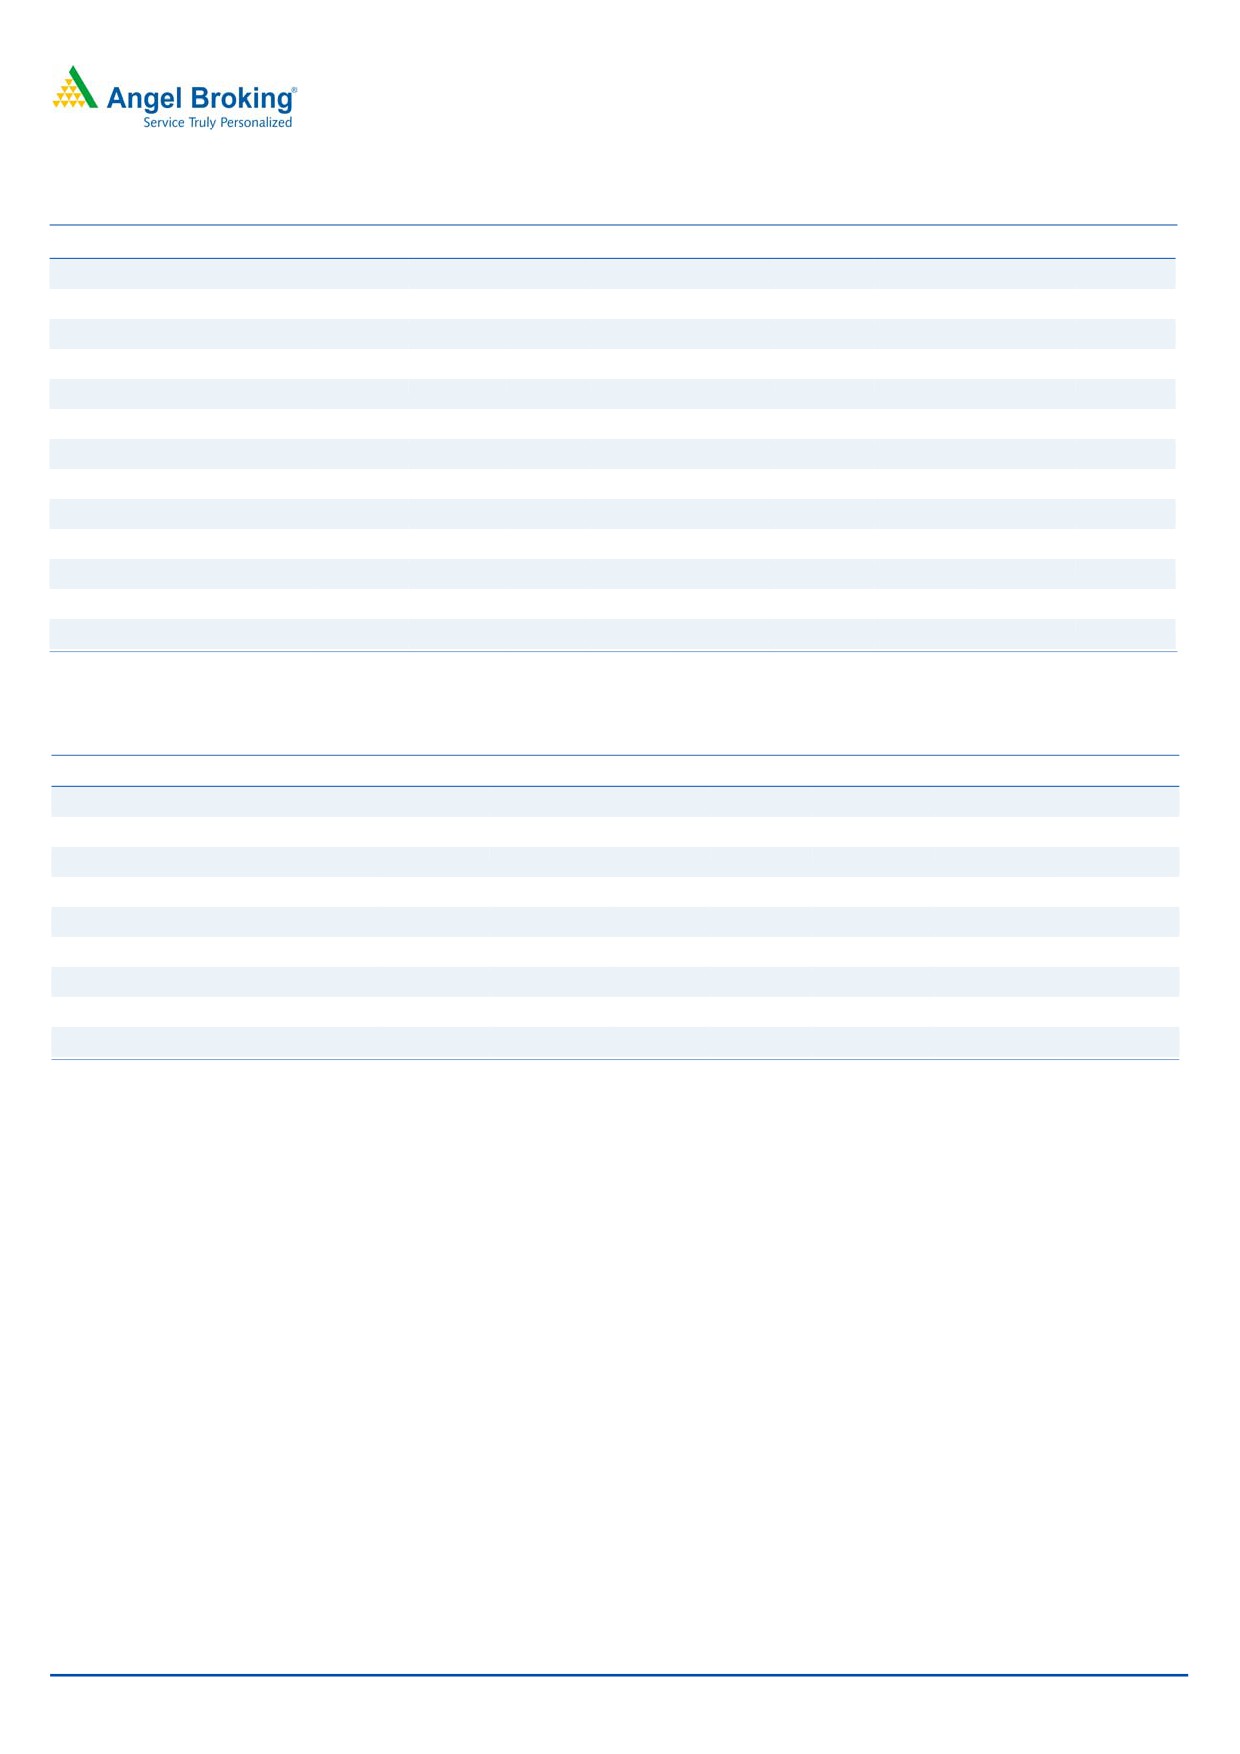
Exhibit 8: Key Operating Parameters
AUM (` Cr)
FY13
FY14
FY15
FY16
Q1FY16
Q4FY16
Q1FY17
YOY%
% QoQ
EMFL
1,135
1,503
2,144
3,283
2,319
3,283
3,442
48.4
4.8
EFL
305
889
1,686
2,596
1,905
2,596
2,859
50.1
10.1
EHFL
45
94
180
246
195
246
257
31.8
4.5
Total
1,485
2,486
4,010
6,125
4,419
6,125
6,558
48.4
7.1
Disbursments (` Cr)
EMFL
1,149
1,505
2,129
3,173
620
931
802
29.4
(13.9)
EFL
300
818
1,365
1,917
413
564
565
36.8
0
EHFL
21
29
24
14.3
(14.3)
Total
1,449
2,323
3,494
5,090
1,054
1,524
1,391
32.0
(8.7)
As % of AUM
EMFL
76.4
60.5
53.5
53.6
52.5
53.6
52.5
EFL
20.5
35.8
42.0
42.4
43.1
42.4
43.6
EHFL
3.0
3.8
4.5
4.0
4.4
4.0
3.9
Source: Company, Angel Research
Exhibit 9: Segmental NPA%
Gross NPAs %
FY13
FY14
FY15
FY16
Q1FY16
Q4FY16
Q1FY17
Microfinance Business
0.00
0.10
0.10
0.23
0.11
0.23
0.25
Non Micro Finance Business
1.00
1.60
2.00
2.49
2.67
2.49
3.03
Net NPAs %
Micro Finance Business
0.00
0.00
0.00
0.06
0.04
0.06
0.05
Non Micro Finance Business
0.70
1.40
1.50
2.49
2.67
2.49
3.03
Consolidated GNPAs %
0.30
0.70
1.08
1.34
1.44
1.34
1.61
Consolidated NNPAs %
0.20
0.60
0.80
0.94
1.07
0.94
1.14
Credit Cost %
0.77
0.93
1.55
1.17
1.56
1.17
1.11
Source: Company, Angel Research
Outlook and valuation
We continue to believe that Equitas is strongly positioned to grow on the back of its
balanced portfolio. Conversion to a SFB will have its own challenges. However, the
market segment which the upcoming bank intends to cater to has vast untapped
business potential and exploiting it effectively will drive the company’s growth for
multiple years. Despite costs having to be incurred in order to meet regulatory
requirements (SLR + SRR), we believe the company will be able to deliver a ROA of
2.5% and ROE of 11.5% by FY2018. At the current market price the stock is
trading at 2.3x its FY2018E BV of `75.6. We maintain BUY on the stock with a
target price of `235.
August 1, 2016
4
Equitas Holdings | 1QFY2017 Result Update
Company Background
Equitas is a diversified financial services player with strong presence across
microfinance, vehicle finance, MSE finance, and housing finance segments.
Incorporated in 2007 and headquartered in Chennai, Equitas operates across 11
states through 549 branches. Equitas, through its subsidiary Equitas Micro Finance
Ltd (EMFL) is the fifth largest microfinance company in India (on gross loan
portfolio basis). Equitas has also received in-principle approval from the RBI to set
up a SFB in October 2015.
Key Management Personnel:
P. N. Vasudevan, Managing Director.
S. Bhaskar, CFO, joined the Equitas Group in 2007.
H.K.N. Raghavan, CEO of EMFL, joined the Equitas Group in 2008.
V. S. Murthy, CEO of Equitas Finance Ltd (EFL), joined the Equitas Group in 2010.
August 1, 2016
5
Equitas Holdings | 1QFY2017 Result Update
Income statement (standalone)
Y/E March (` cr)
FY2014
FY2015
FY2016
FY2017E
FY2018E
NII
293
460
675
934
1,274
- YoY Growth (%)
67.8
57.2
46.6
38.4
36.4
Other Income
1.1
0.9
3.9
5.1
6.9
- YoY Growth (%)
-
-
-
30.5
35.0
Operating Income
294.0
461.2
678.9
939.2
1280.8
- YoY Growth (%)
67.5
56.9
47.2
38.3
36.4
Operating Expenses
161.8
247.2
359.7
535.4
730.1
- YoY Growth (%)
28.4
52.8
45.5
48.8
36.4
Pre - Provision Profit
132.2
214.0
319.2
403.9
550.7
- YoY Growth (%)
166.9
61.9
49.2
26.5
36.4
Prov. & Cont.
18.4
50.4
59.1
102.9
138.9
- YoY Growth (%)
106.5
174.1
17.2
74.1
35.0
Profit Before Tax
113.8
163.6
260.1
301.0
411.8
- YoY Growth (%)
186.3
43.7
59.0
15.7
36.8
Prov. for Taxation
39.5
56.6
93.0
105.3
135.9
- as a % of PBT
35
35
36
35
33
PAT
74.3
107.0
167.1
195.6
275.9
- YoY Growth (%)
133.0
44.0
56.2
17.1
41.0
Balance sheet (standalone)
Y/E March (` cr)
FY2014 FY2015 FY2016
FY2017E
FY2018E
Share Capital
73
269
270
335
335
Reserve & Surplus
669
902
1,071
1,921
2,197
Net Worth
742
1,172
1,341
2,256
2,532
Borrowings
1,849
3,032
4,683
6,557
7,868
- Growth (%)
45
64
54
40
20
Deposits
-
-
-
350
1,850
- Growth (%)
-
-
-
-
429
Other Liab. & Prov.
160
262
482
426
575
Total Liabilities
2,751
4,466
6,507
9,588
12,825
Cash and Cash Equivalents
415
557
947
852
958
Investments
72
176
12
1,468
1,731
Advances
2,123
3,465
5,070
7,098
9,583
- Growth (%)
75
63
46
40
35
Fixed Assets
27
47
66
86
111
Other Assets
114
222
412
85
442
Total Assets
2,751
4,466
6,507
9,588
12,825
August 1, 2016
6
Equitas Holdings | 1QFY2017 Result Update
Ratio analysis (standalone)
Y/E March
FY2014
FY2015
FY2016
FY2017E
FY2018E
Profitability ratios (%)
NIMs
12.9
12.9
12.4
11.7
11.5
RoA
3.3
3.0
3.1
2.5
2.5
RoE
12.2
11.2
13.3
10.9
11.5
Asset Quality (%)
Gross NPAs
15.5
37.4
68.1
140.3
188.4
Gross NPAs %
0.7
1.1
1.3
1.6
1.6
Net NPAs
13.0
27.8
47.8
87.0
116.8
Net NPAs %
0.6
0.8
0.9
1.0
1.0
Credit Cost
0.9
1.5
1.2
1.2
1.2
Per Share Data (`)
EPS
10.2
4.0
6.2
5.8
8.2
BVPS
102.1
43.6
49.7
67.4
75.6
Adj BV
100.3
42.5
47.9
64.8
72.1
Valuation Ratios
PER (x)
19.1
49.0
31.5
33.4
23.7
P/ABVPS (x)
NA
NA
4.1
3.0
2.7
Dividend Yield (%)
-
-
-
-
-
DuPont Analysis
Interest Income
21.0
20.9
20.2
19.3
18.4
Interest Expenses
8.2
8.2
7.9
7.7
7.1
NII
12.7
12.8
12.3
11.6
11.4
(-) Prov. Exp.
0.0
0.0
0.1
0.1
0.1
Adj. NII
12.8
12.8
12.4
11.7
11.4
Other Inc.
7.0
6.9
6.6
6.7
6.5
Op. Inc.
5.7
5.9
5.8
5.0
4.9
Opex
0.8
1.4
1.1
1.3
1.2
PBT
4.9
4.5
4.7
3.7
3.7
Taxes
1.7
1.6
1.7
1.3
1.2
RoA
3.2
3.0
3.0
2.4
2.5
Leverage
3.8
3.8
4.4
4.5
4.7
RoE
12.2
11.2
13.3
10.9
11.5
August 1, 2016
7
Equitas Holdings | 1QFY2017 Result Update
Research Team Tel: 022 - 39357800
DISCLAIMER
Angel Broking Private Limited (hereinafter referred to as “Angel”) is a registered Member of National Stock Exchange of India Limited,
Bombay Stock Exchange Limited and Metropolitan Stock Exchange Limited. It is also registered as a Depository Participant with CDSL
and Portfolio Manager with SEBI. It also has registration with AMFI as a Mutual Fund Distributor. Angel Broking Private Limited is a
registered entity with SEBI for Research Analyst in terms of SEBI (Research Analyst) Regulations, 2014 vide registration number
INH000000164. Angel or its associates has not been debarred/ suspended by SEBI or any other regulatory authority for accessing
/dealing in securities Market. Angel or its associates/analyst has not received any compensation / managed or co-managed public
offering of securities of the company covered by Analyst during the past twelve months.
This document is solely for the personal information of the recipient, and must not be singularly used as the basis of any investment
decision. Nothing in this document should be construed as investment or financial advice. Each recipient of this document should
make such investigations as they deem necessary to arrive at an independent evaluation of an investment in the securities of the
companies referred to in this document (including the merits and risks involved), and should consult their own advisors to determine
the merits and risks of such an investment.
Reports based on technical and derivative analysis center on studying charts of a stock's price movement, outstanding positions and
trading volume, as opposed to focusing on a company's fundamentals and, as such, may not match with a report on a company's
fundamentals. Investors are advised to refer the Fundamental and Technical Research Reports available on our website to evaluate the
contrary view, if any.
The information in this document has been printed on the basis of publicly available information, internal data and other reliable
sources believed to be true, but we do not represent that it is accurate or complete and it should not be relied on as such, as this
document is for general guidance only. Angel Broking Pvt. Limited or any of its affiliates/ group companies shall not be in any way
responsible for any loss or damage that may arise to any person from any inadvertent error in the information contained in this report.
Angel Broking Pvt. Limited has not independently verified all the information contained within this document. Accordingly, we cannot
testify, nor make any representation or warranty, express or implied, to the accuracy, contents or data contained within this document.
While Angel Broking Pvt. Limited endeavors to update on a reasonable basis the information discussed in this material, there may be
regulatory, compliance, or other reasons that prevent us from doing so.
This document is being supplied to you solely for your information, and its contents, information or data may not be reproduced,
redistributed or passed on, directly or indirectly.
Neither Angel Broking Pvt. Limited, nor its directors, employees or affiliates shall be liable for any loss or damage that may arise from
or in connection with the use of this information.
Disclosure of Interest Statement
Equitas Holdings
1. Financial interest of research analyst or Angel or his Associate or his relative
No
2. Ownership of 1% or more of the stock by research analyst or Angel or associates or relatives
No
3. Served as an officer, director or employee of the company covered under Research
No
4. Broking relationship with company covered under Research
No
Ratings (Based on expected returns
Buy (> 15%)
Accumulate (5% to 15%)
Neutral (-5 to 5%)
over 12 months investment period):
Reduce (-5% to -15%)
Sell (< -15)
August 1, 2016
8